
Technical Analysis 10/06/2020

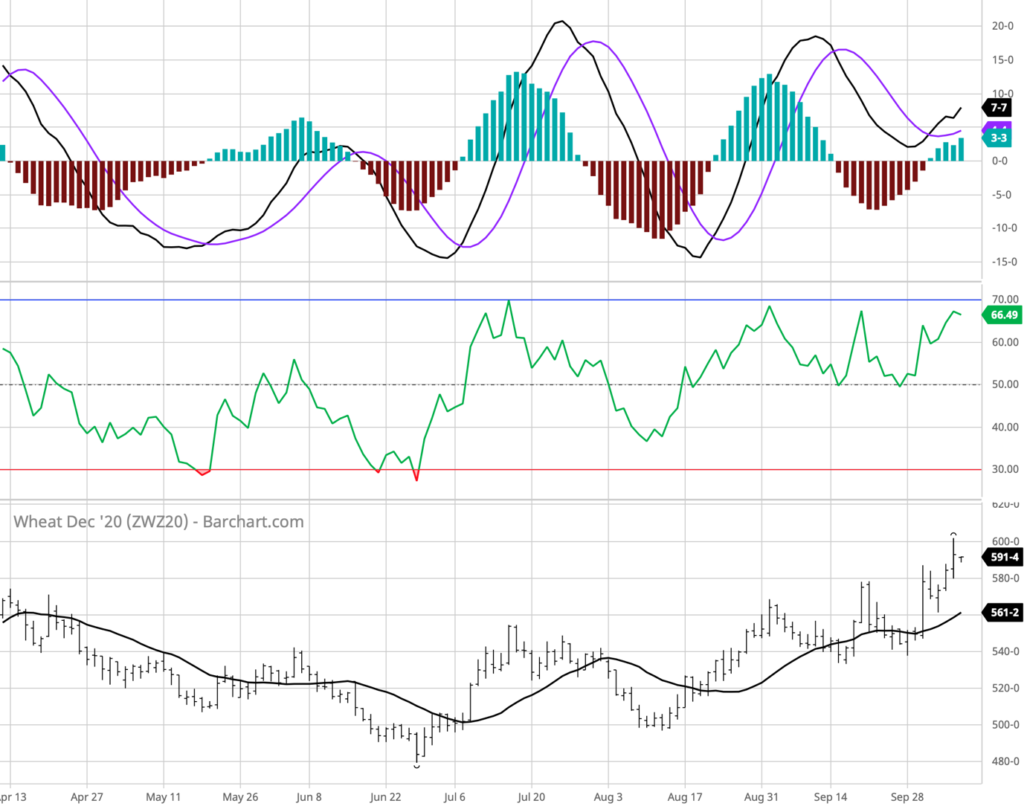
Wheat December 2020.
Wheat futures closed off their highs, but still maintained comfortable gains on the day. KC HRW futures were the strongest, closing with double digit gains through May ’21. SRW closed 6 3/4 to 8 1/2 cents higher in the front months. MGE spring wheat ended the day up by 1 to 2 3/4 cents. Market fully focused on the Black Sea dryness, Russia specifically needs to see some rains in the forecast to slow the current trend. Plenty of questions remain around what a dry fall could mean for current exports and possible quotas but also for next years crop- typically it’s the spring/early summer weather that makes the crops. U.S. Plains continue to be a bit dry as well. Argentina now working in the cheapest origin, followed by Baltics, German and then Russia. Official exports through the first quarter of the MY were a 3-yr high 265 mbu. August wheat exports to China were the largest since the 2013/14 MY. For the MYTD 610,453 MT of wheat has been shipped to China. The trade is looking for USDA to show between 830 and 917 mbu for the October ending stocks forecast. USDA’s monthly Supply and demand estimates are to be released on Friday. Analysts are also expecting a 2.2 MMT reduction for world stocks in that report.
- Dec 20 CBOT Wheat closed at $5.92 3/4, up 8 1/2 cents,
- Dec 20 KCBT Wheat closed at $5.34 1/4, up 10 cents,
- Dec 20 MGEX Wheat closed at $5.38 1/4, up 2 3/4 cents.
Pivot Points
|
Name |
S3 |
S2 |
S1 |
Pivot Points |
R1 |
R2 |
R3 |
|
Classic |
586.28 |
587.45 |
588.28 |
589.45 |
590.28 |
591.45 |
592.28 |
|
Fibonacci |
587.45 |
588.21 |
588.69 |
589.45 |
590.21 |
590.69 |
591.45 |
|
Camarilla |
588.57 |
588.75 |
588.94 |
589.45 |
589.30 |
589.49 |
589.67 |
|
Woodie’s |
586.12 |
587.37 |
588.12 |
589.37 |
590.12 |
591.37 |
592.12 |
|
DeMark’s |
– |
– |
587.87 |
589.25 |
589.87 |
– |
– |
Technical Indicators
|
Name |
Value |
Action |
|
RSI(14) |
58.385 |
Buy |
|
STOCH(9,6) |
28.064 |
Sell |
|
STOCHRSI(14) |
18.494 |
Oversold |
|
MACD(12,26) |
2.540 |
Buy |
|
ADX(14) |
48.918 |
Buy |
|
Williams %R |
-50.675 |
Neutral |
|
CCI(14) |
10.7757 |
Neutral |
|
ATR(14) |
3.7507 |
High Volatility |
|
Highs/Lows(14) |
0.0000 |
Neutral |
|
Ultimate Oscillator |
50.210 |
Neutral |
|
ROC |
1.499 |
Buy |
|
Bull/Bear Power(13) |
0.8400 |
Buy |
|
Buy: 5 Sell: 1 Neutral: 4 Summary:BUY |
||
Moving Averages
|
Period |
Simple |
Exponential |
|
MA5 |
590.25 |
590.97 |
|
MA10 |
592.29 |
590.21 |
|
MA20 |
588.34 |
589.00 |
|
MA50 |
583.10 |
583.73 |
|
MA100 |
575.86 |
575.93 |
|
MA200 |
561.55 |
567.28 |
|
Buy: 11 Sell: 1 Summary:BUY |
||
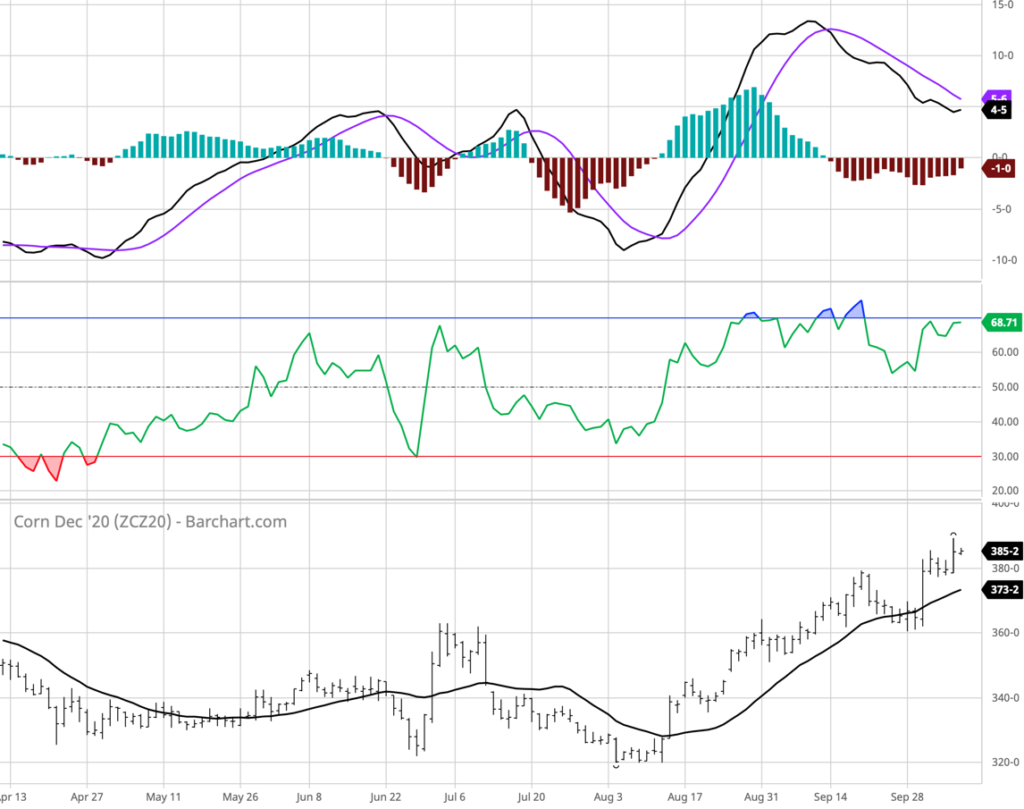
Corn December 2020.
Corn prices strengthened 3 to 5 1/2 cents on Tuesday. The national average corn basis from cmdtyView is 28 cents under Dec, which is the strongest since the basis metric rolled to Dec futures. The average trade estimate for production is 14.823 bbu, with estimates between 14.638 and 15.030. Traders expect USDA to show corn ending stocks at 2.120 bbu. That would be down 383 mbu from September if realized. U.S. still remains the cheapest FOB right now and this likely to remain this way until the Brazil safrinha crop comes, Ukraine is now too tight to go cheaper. Still a nice forecast shall allow harvest to move along rather nicely in the U.S., currently harvest remains at 25% vs 15% LW and vs 24% average, expect big advancements over the next 2-3 weeks. Ukraine harvest still dealing with some rains, but overall we still a bit early to make any big decisions. The question is what will USDA shows for Ukraine on Friday? Brazil plays a big role for corn price as off now, especially with possible dryness. MY. Corn exports to China in August was the largest for any month on record to that destination. The total 2019/20 corn exports to the PRC were 164.9 mbu, which was the largest since the 2011/2012 MY.
- Dec 20 Corn closed at $3.85, up 5 1/2 cents,
- Mar 21 Corn closed at $3.94 1/4, up 5 cents,
- May 21 Corn closed at $3.99 1/4, up 4 1/2 cents,
- Jul 21 Corn closed at $4.02 3/4, up 4 1/2 cents
Pivot Points
|
Name |
S3 |
S2 |
S1 |
Pivot Points |
R1 |
R2 |
R3 |
|
Classic |
383.04 |
383.71 |
384.04 |
384.71 |
385.04 |
385.71 |
386.04 |
|
Fibonacci |
383.71 |
384.09 |
384.33 |
384.71 |
385.09 |
385.33 |
385.71 |
|
Camarilla |
384.11 |
384.20 |
384.29 |
384.71 |
384.47 |
384.56 |
384.66 |
|
Woodie’s |
382.88 |
383.63 |
383.88 |
384.63 |
384.88 |
385.63 |
385.88 |
|
DeMark’s |
– |
– |
383.88 |
384.63 |
384.88 |
– |
– |
Technical Indicators
|
Name |
Value |
Action |
|
RSI(14) |
59.468 |
Buy |
|
STOCH(9,6) |
35.247 |
Sell |
|
STOCHRSI(14) |
15.472 |
Oversold |
|
MACD(12,26) |
1.270 |
Buy |
|
ADX(14) |
54.019 |
Buy |
|
Williams %R |
-44.000 |
Buy |
|
CCI(14) |
22.5997 |
Neutral |
|
ATR(14) |
1.6336 |
High Volatility |
|
Highs/Lows(14) |
0.0000 |
Neutral |
|
Ultimate Oscillator |
47.814 |
Sell |
|
ROC |
1.251 |
Buy |
|
Bull/Bear Power(13) |
0.9680 |
Buy |
|
Buy: 6 Sell: 2 Neutral: 2 Summary:STRONG BUY |
||
Moving Averages
|
Period |
Simple |
Exponential |
|
MA5 |
384.85 |
385.16 |
|
MA10 |
385.69 |
384.68 |
|
MA20 |
383.53 |
383.85 |
|
MA50 |
381.25 |
381.78 |
|
MA100 |
379.33 |
378.80 |
|
MA200 |
372.17 |
375.16 |
|
Buy: 11 Sell: 1 Summary:BUY |
||
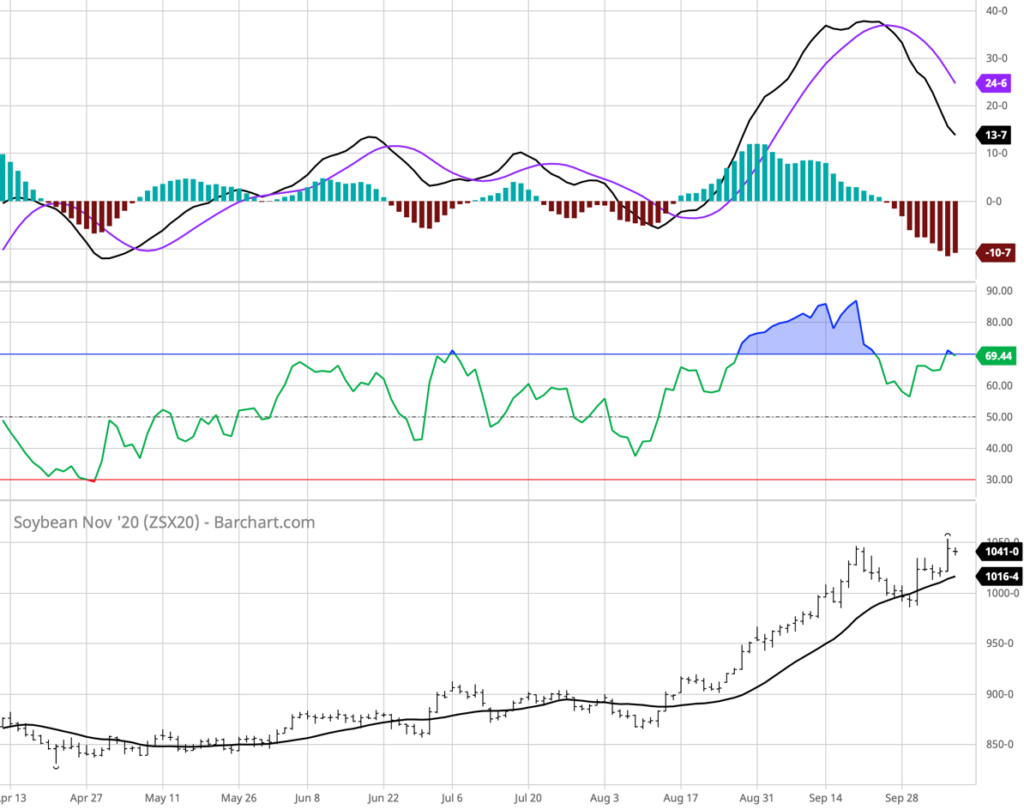
Soybeans November 2020.
Pre-report trading left the soy complex solidly in the black. Meal was the strongest on the day with 2.14% to 3.11% gains. Soybeans closed with double digit gains through May ’21 contracts, with Nov up 2.2% on the day. Soybean oil futures closed 48 to 53 points higher. USDA announced a private export sale of 154,400 MT of soybeans to unknown. Export inspections remain high enough and China remains 72% of them- stays ahead of the pace needed by 98 mbu, and the number was the highest since Nov 2019. Brazil will play big role in the market, if gets enough showers obviously. Brazil plants speed is 50% slower than last year. Weather still allowing for a nice U.S. harvest- this past week its reported harvest remains 38%, vs 20% LW and vs the av. of 28%. On average, analysts are looking for USDA to show soy production at 4.288 bbu. That would be down 25 mbu from Sept if realized. USDA will factor September frost/freeze damage into this report, as it occurred too late to be in the September edition.
- Nov 20 Soybeans closed at $10.44, up 22 1/2 cents,
- Jan 21 Soybeans closed at $10.45 1/2, up 20 1/2 cents,
- Mar 21 Soybeans closed at $10.35 1/4, up 17 cents,
- May 21 Soybeans closed at $10.30, up 12 1/4 cents,
- Oct 20 Soybean Meal closed at $354.30, up $10.70
- Oct 20 Soybean Oil closed at $33.29, up $0.48.
Pivot Points
|
Name |
S3 |
S2 |
S1 |
Pivot Points |
R1 |
R2 |
R3 |
|
Classic |
1034.78 |
1036.20 |
1038.66 |
1040.08 |
1042.54 |
1043.96 |
1046.42 |
|
Fibonacci |
1036.20 |
1037.68 |
1038.60 |
1040.08 |
1041.56 |
1042.48 |
1043.96 |
|
Camarilla |
1040.05 |
1040.41 |
1040.76 |
1040.08 |
1041.48 |
1041.83 |
1042.19 |
|
Woodie’s |
1035.30 |
1036.46 |
1039.18 |
1040.34 |
1043.06 |
1044.22 |
1046.94 |
|
DeMark’s |
– |
– |
1039.37 |
1040.43 |
1043.25 |
– |
– |
Technical Indicators
|
Name |
Value |
Action |
|
RSI(14) |
60.422 |
Buy |
|
STOCH(9,6) |
33.734 |
Sell |
|
STOCHRSI(14) |
16.689 |
Oversold |
|
MACD(12,26) |
4.220 |
Buy |
|
ADX(14) |
60.815 |
Buy |
|
Williams %R |
-51.599 |
Neutral |
|
CCI(14) |
2.9244 |
Neutral |
|
ATR(14) |
4.3271 |
High Volatility |
|
Highs/Lows(14) |
0.0000 |
Neutral |
|
Ultimate Oscillator |
44.391 |
Sell |
|
ROC |
1.019 |
Buy |
|
Bull/Bear Power(13) |
2.0520 |
Buy |
|
Buy: 5 Sell: 2 Neutral: 3 Summary:BUY |
||
Moving Averages
|
Period |
Simple |
Exponential |
|
MA5 |
1040.87 |
1041.32 |
|
MA10 |
1043.02 |
1040.42 |
|
MA20 |
1037.67 |
1037.66 |
|
MA50 |
1027.76 |
1030.90 |
|
MA100 |
1023.45 |
1023.83 |
|
MA200 |
1011.91 |
1016.87 |
|
Buy: 10 Sell: 2 Summary:BUY |
||
Read also
Wheat in Southern Brazil Impacted by Dry Weather and Frosts
Oilseed Industry. Leaders and Strategies in the Times of a Great Change
Black Sea & Danube Region: Oilseed and Vegoil Markets Within Ongoing Transfor...
Serbia. The drought will cause extremely high losses for farmers this year
2023/24 Safrinha Corn in Brazil 91% Harvested


Got additional questions?
We will be happy to assist!
Write to us
Our manager will contact you soon