
Australian barley following in the footsteps of corn
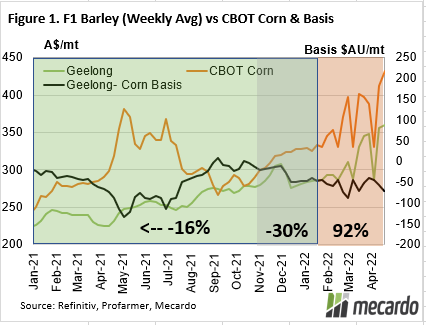
Since the start of February, when the Ukrainian conflict tensions began, the evolution of the domestic port bid price of Australian barley has begin to shadow nearby US corn prices.
The average weekly price of barley has shot up 23%, and similarly, nearby US corn prices have surged 25%.
As well as following the general trend over the last few months, the Australian barley price has fluctuated almost in lockstep with US corn prices. By no means have they shared the same price however, with the average basis, or discount of Australian barley to the US nearby corn price being -$57. (black line on figure 1)
Correlation is a statistical measure of how closely related two prices are over time, and is measured as a number between -1 and 1, with negative numbers indicating an inverse relationship. Since February, the pairwise correlation between barley and corn was 92% (figure 1) – a pretty strong indication that their prices move closely together and are driven by very similar, if not the same fundamental factors. The strong correlation makes a lot of sense given that both are animal feed grains which are traded in linked international markets.
However, this strong relationship seems to be new, or potentially inconsistent, as in the prior three months to February, the data suggests that the two grains had a weak negative correlation of -30%, (figure 1), and almost no discernable relationship (-16%) if we take the analysis back as far as early 2019. Just glancing at the chart in (figure 1) makes it abundantly clear that the two commodities were moving in wildly different circles over the last year.
An identifiable major change in price behavior such as this is termed a structural break. It appears that the cause has effectively been the war between Russia & Ukraine and the massive upheaval in expected corn & wheat supply from the Black Sea.
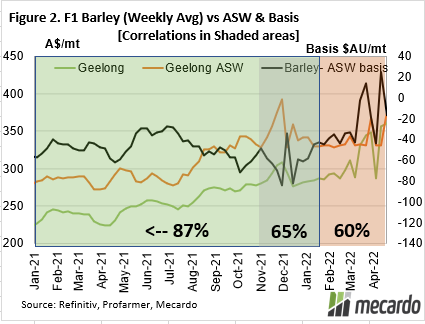
Just prior to the incidence of the war related structural break, Geelong delivered barley prices were slightly more closely related to ASW wheat prices than they are now (65% vs 60%), but on a more long-term basis, the relationship between them sits at 87%.
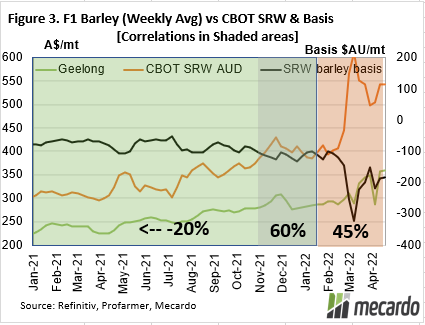
Examining the relationship between nearby CBOT SRW wheat prices and Aussie barley shows that a moderately positive 45% correlation has been evident since the war broke out. This is somewhat weaker than the three months prior which was at 60% (Figure 3). Over a longer-term horizon though, a very weakly negative relationship exists. Overall, SRW wheat price movements and economic fundamentals are only moderately useful in the short term when considering Aussie barley pricing. The improved apparent relationship between the two in more recent times compared to the long term is most likely attributed to the general uptick in all grain pricing lately.
Read also
Wheat in Southern Brazil Impacted by Dry Weather and Frosts
Oilseed Industry. Leaders and Strategies in the Times of a Great Change
Black Sea & Danube Region: Oilseed and Vegoil Markets Within Ongoing Transfor...
Serbia. The drought will cause extremely high losses for farmers this year
2023/24 Safrinha Corn in Brazil 91% Harvested


Got additional questions?
We will be happy to assist!
Write to us
Our manager will contact you soon